
| July 2016 |
| Percent changes calculated using year-over-year comparisons. |
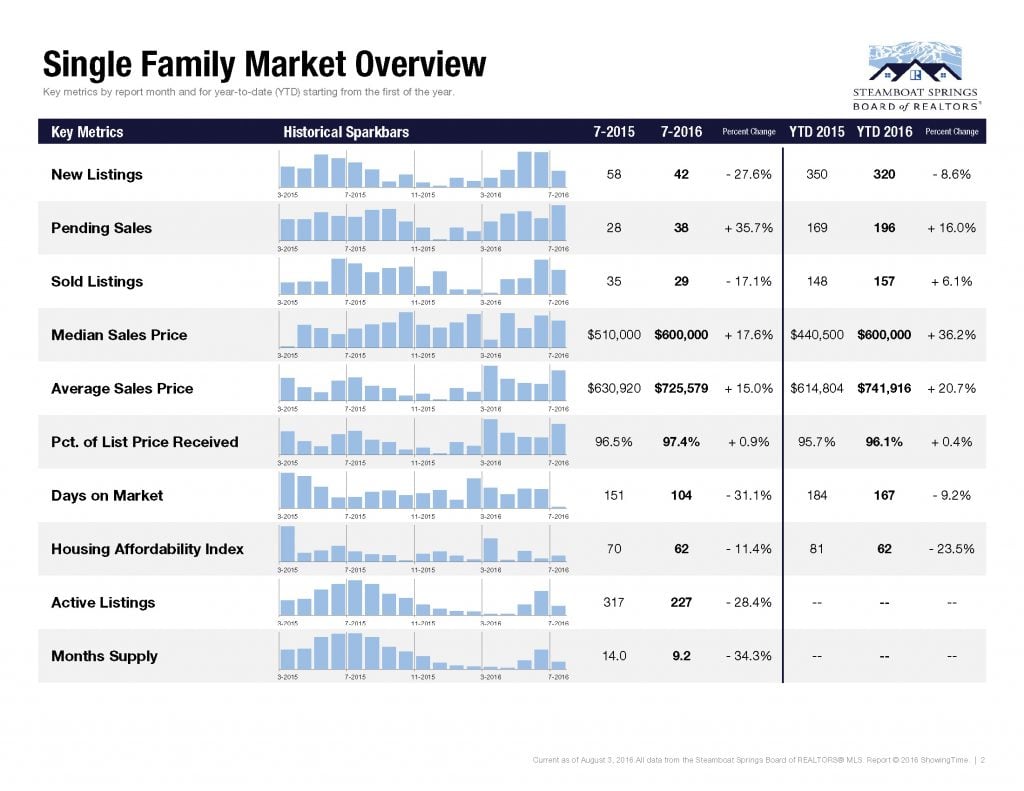
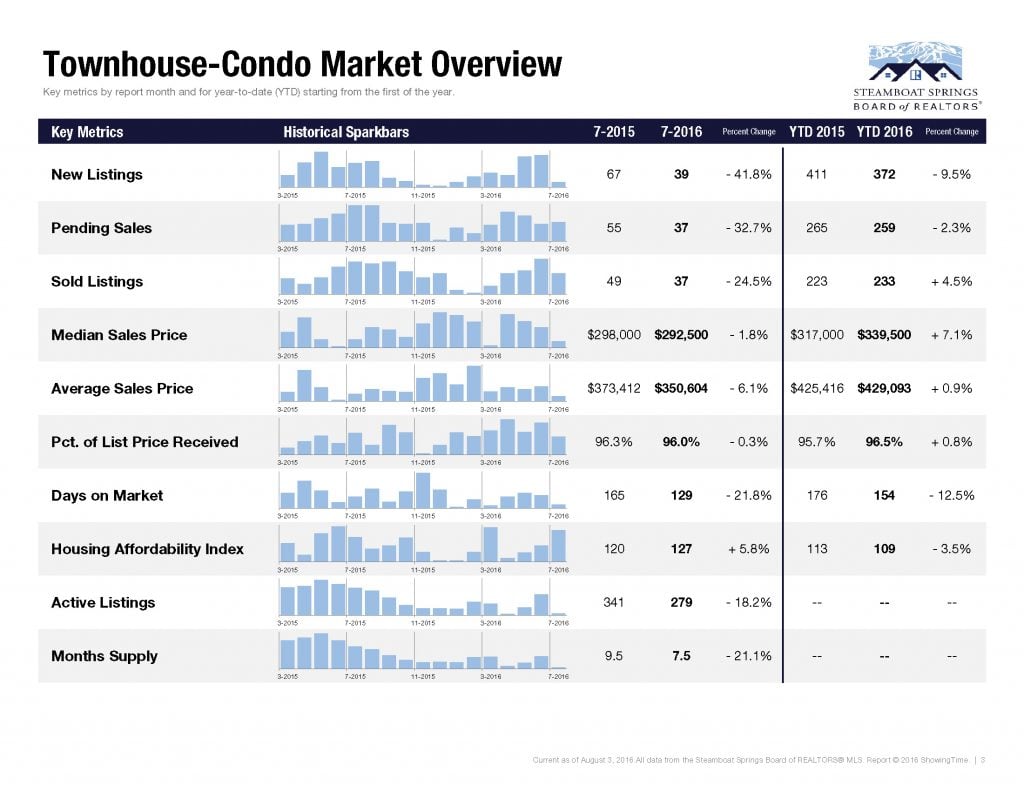
| New Listings were down 27.6 percent for single family homes and 41.8 percent for townhouse-condo properties. Pending Sales increased 35.7 percent for single family homes but decreased 32.7 percent for townhouse-condo properties. The Median Sales Price was up 17.6 percent to $600,000 for single family homes but decreased 1.8 percent to $292,500 for townhouse-condo properties. Days on Market decreased 31.1 percent for single family homes and 21.8 percent for condo properties. Low housing supply has already prevented an outright national boon in sales activity, despite a continuation of near record-low mortgage rates and an unemployment rate under 5.0 percent deep into 2016. The issue is not purchasing power. Many areas are falling behind last year’s closed sales totals simply because of lack of available inventory. As this continues, higher prices may put a deeper squeeze on the current buyer pool. |
| Activity Snapshot |
|||
| – 14.3% | + 12.6% | – 23.8% | |
| One-Year Change in | One-Year Change in | One-Year Change in | |
| Sold Listings All Properties | Median Sales Price All Properties | Active Listings All Properties | |
| Residential real estate activity in zip codes 80487, 81639 and 80467, comprised of single-family properties, townhomes and condominiums. Percent changes are calculated using rounded figures. |
|||
[gview file=”https://assets.thesparksite.com/uploads/sites/1542/2016/08/Steamboat-Market-Profile-2016-July-1.pdf”]
Single Family Market Overview
| KEY METRICS |
7-2015 |
7-2016 |
PERCENT CHANGE |
YTD 2015 |
YTD 2016 |
PERCENT CHANGE |
|||||||||||||||||
| New Listings | 67 | 39 | -41.8% | 411 | 372 | -9.5% | |||||||||||||||||
| Pending Sales | 55 | 37 | – 32.7% | 265 | 259 | – 2.3% | |||||||||||||||||
| Sold Listings | 49 | 37 | – 24.5% | 223 | 233 | + 4.5% | |||||||||||||||||
| Median Sales Price | $298,000 | $292,500 | – 1.8% | $317,000 | $339,500 | + 7.1% | |||||||||||||||||
| Average Sales Price | $373,412 | $350,604 | – 6.1% | $425,416 | $429,093 | + 0.9% | |||||||||||||||||
| Pct. of List Price Received | 96.3% | 96.0% | – 0.3% | 95.7% | 96.5% | + 0.8% | |||||||||||||||||
| Days on Market | 165 | 129 | – 21.8% | 176 | 154 | – 12.5% | |||||||||||||||||
| Housing Affordability Index | 120 | 127 | + 5.8% | 113 | 109 | – 3.5% | |||||||||||||||||
| Active Listings | 341 | 279 | – 18.2% | — | — | — | |||||||||||||||||
| Months Supply | 9.5 | 7.5 | – 21.1% | — | — | — | |||||||||||||||||
Townhouse-Condo Market Overview
| KEY METRICS |
7-2015 |
7-2016 |
PERCENT CHANGE |
YTD 2015 |
YTD 2016 |
PERCENT CHANGE |
|||||||||||||||||
| New Listings | 67 | 39 | -41.8% | 411 | 372 | -9.5 | |||||||||||||||||
| Pending Sales | 55 | 37 | – 32.7% | 265 | 259 | – 2.3% | |||||||||||||||||
| Sold Listings | 49 | 37 | – 24.5% | 223 | 233 | + 4.5% | |||||||||||||||||
| Median Sales Price | $298,000 | $292,500 | – 1.8% | $317,000 | $339,500 | + 7.1% | |||||||||||||||||
| Average Sales Price | $373,412 | $350,604 | – 6.1% | $425,416 | $429,093 | + 0.9% | |||||||||||||||||
| Pct. of List Price Received | 96.3% | 96.0% | – 0.3% | 95.7% | 96.5% | + 0.8% | |||||||||||||||||
| Days on Market | 165 | 129 | – 21.8% | 176 | 154 | – 12.5% | |||||||||||||||||
| Housing Affordability Index | 120 | 127 | + 5.8% | 113 | 109 | – 3.5% | |||||||||||||||||
| Active Listings | 341 | 279 | – 18.2% | — | — | — | |||||||||||||||||
| Months Supply | 9.5 | 7.5 | – 21.1% | — | — | — | |||||||||||||||||
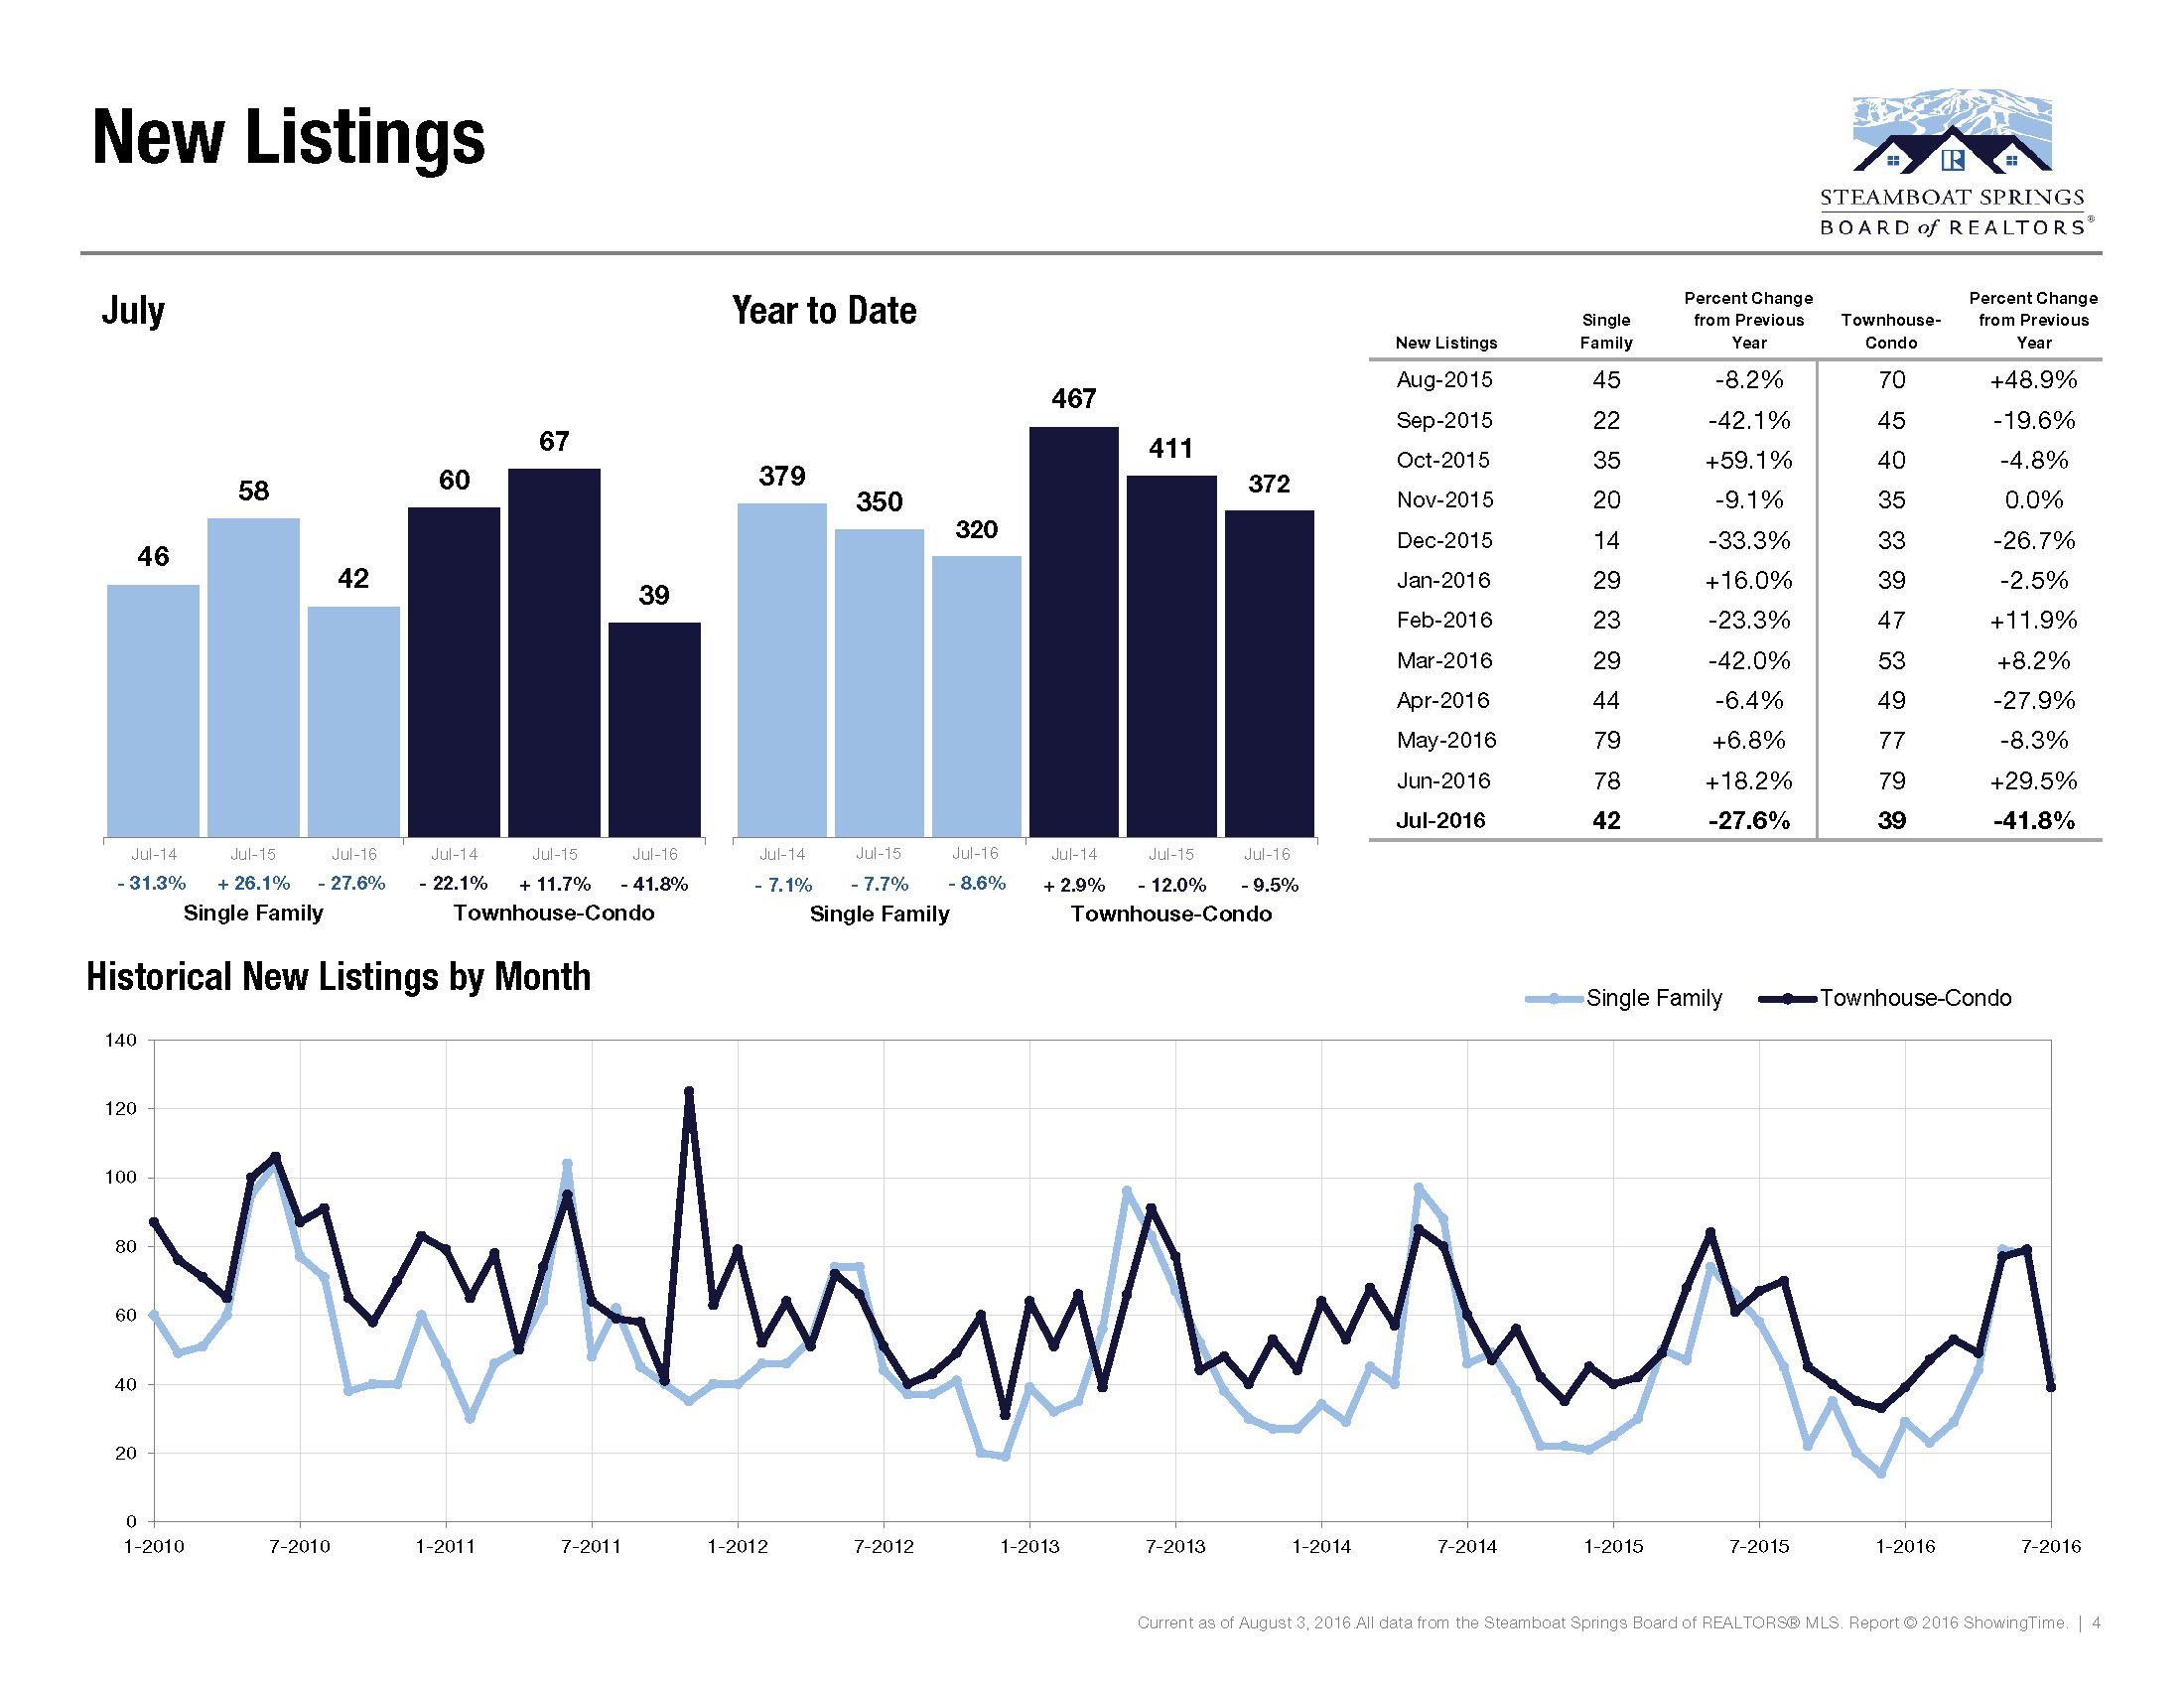
| New Listings Aug-2015 |
Single Family 45 |
Percent Change -8.2% |
Townhouse –Condo 70 |
Percent Change +48.9% |
| Sep-2015 | 22 | -42.1% | 45 | -19.6% |
| Oct-2015 | 35 | +59.1% | 40 | -4.8% |
| Nov-2015 | 20 | -9.1% | 35 | 0.0% |
| Dec-2015 | 14 | -33.3% | 33 | -26.7% |
| Jan-2016 | 29 | +16.0% | 39 | -2.5% |
| Feb-2016 | 23 | -23.3% | 47 | +11.9% |
| Mar-2016 | 29 | -42.0% | 53 | +8.2% |
| Apr-2016 | 44 | -6.4% | 49 | -27.9% |
| May-2016 | 79 | +6.8% | 77 | -8.3% |
| Jun-2016 | 78 | +18.2% | 79 | +29.5% |
| Jul-2016 | 42 | -27.6% | 39 | -41.8% |
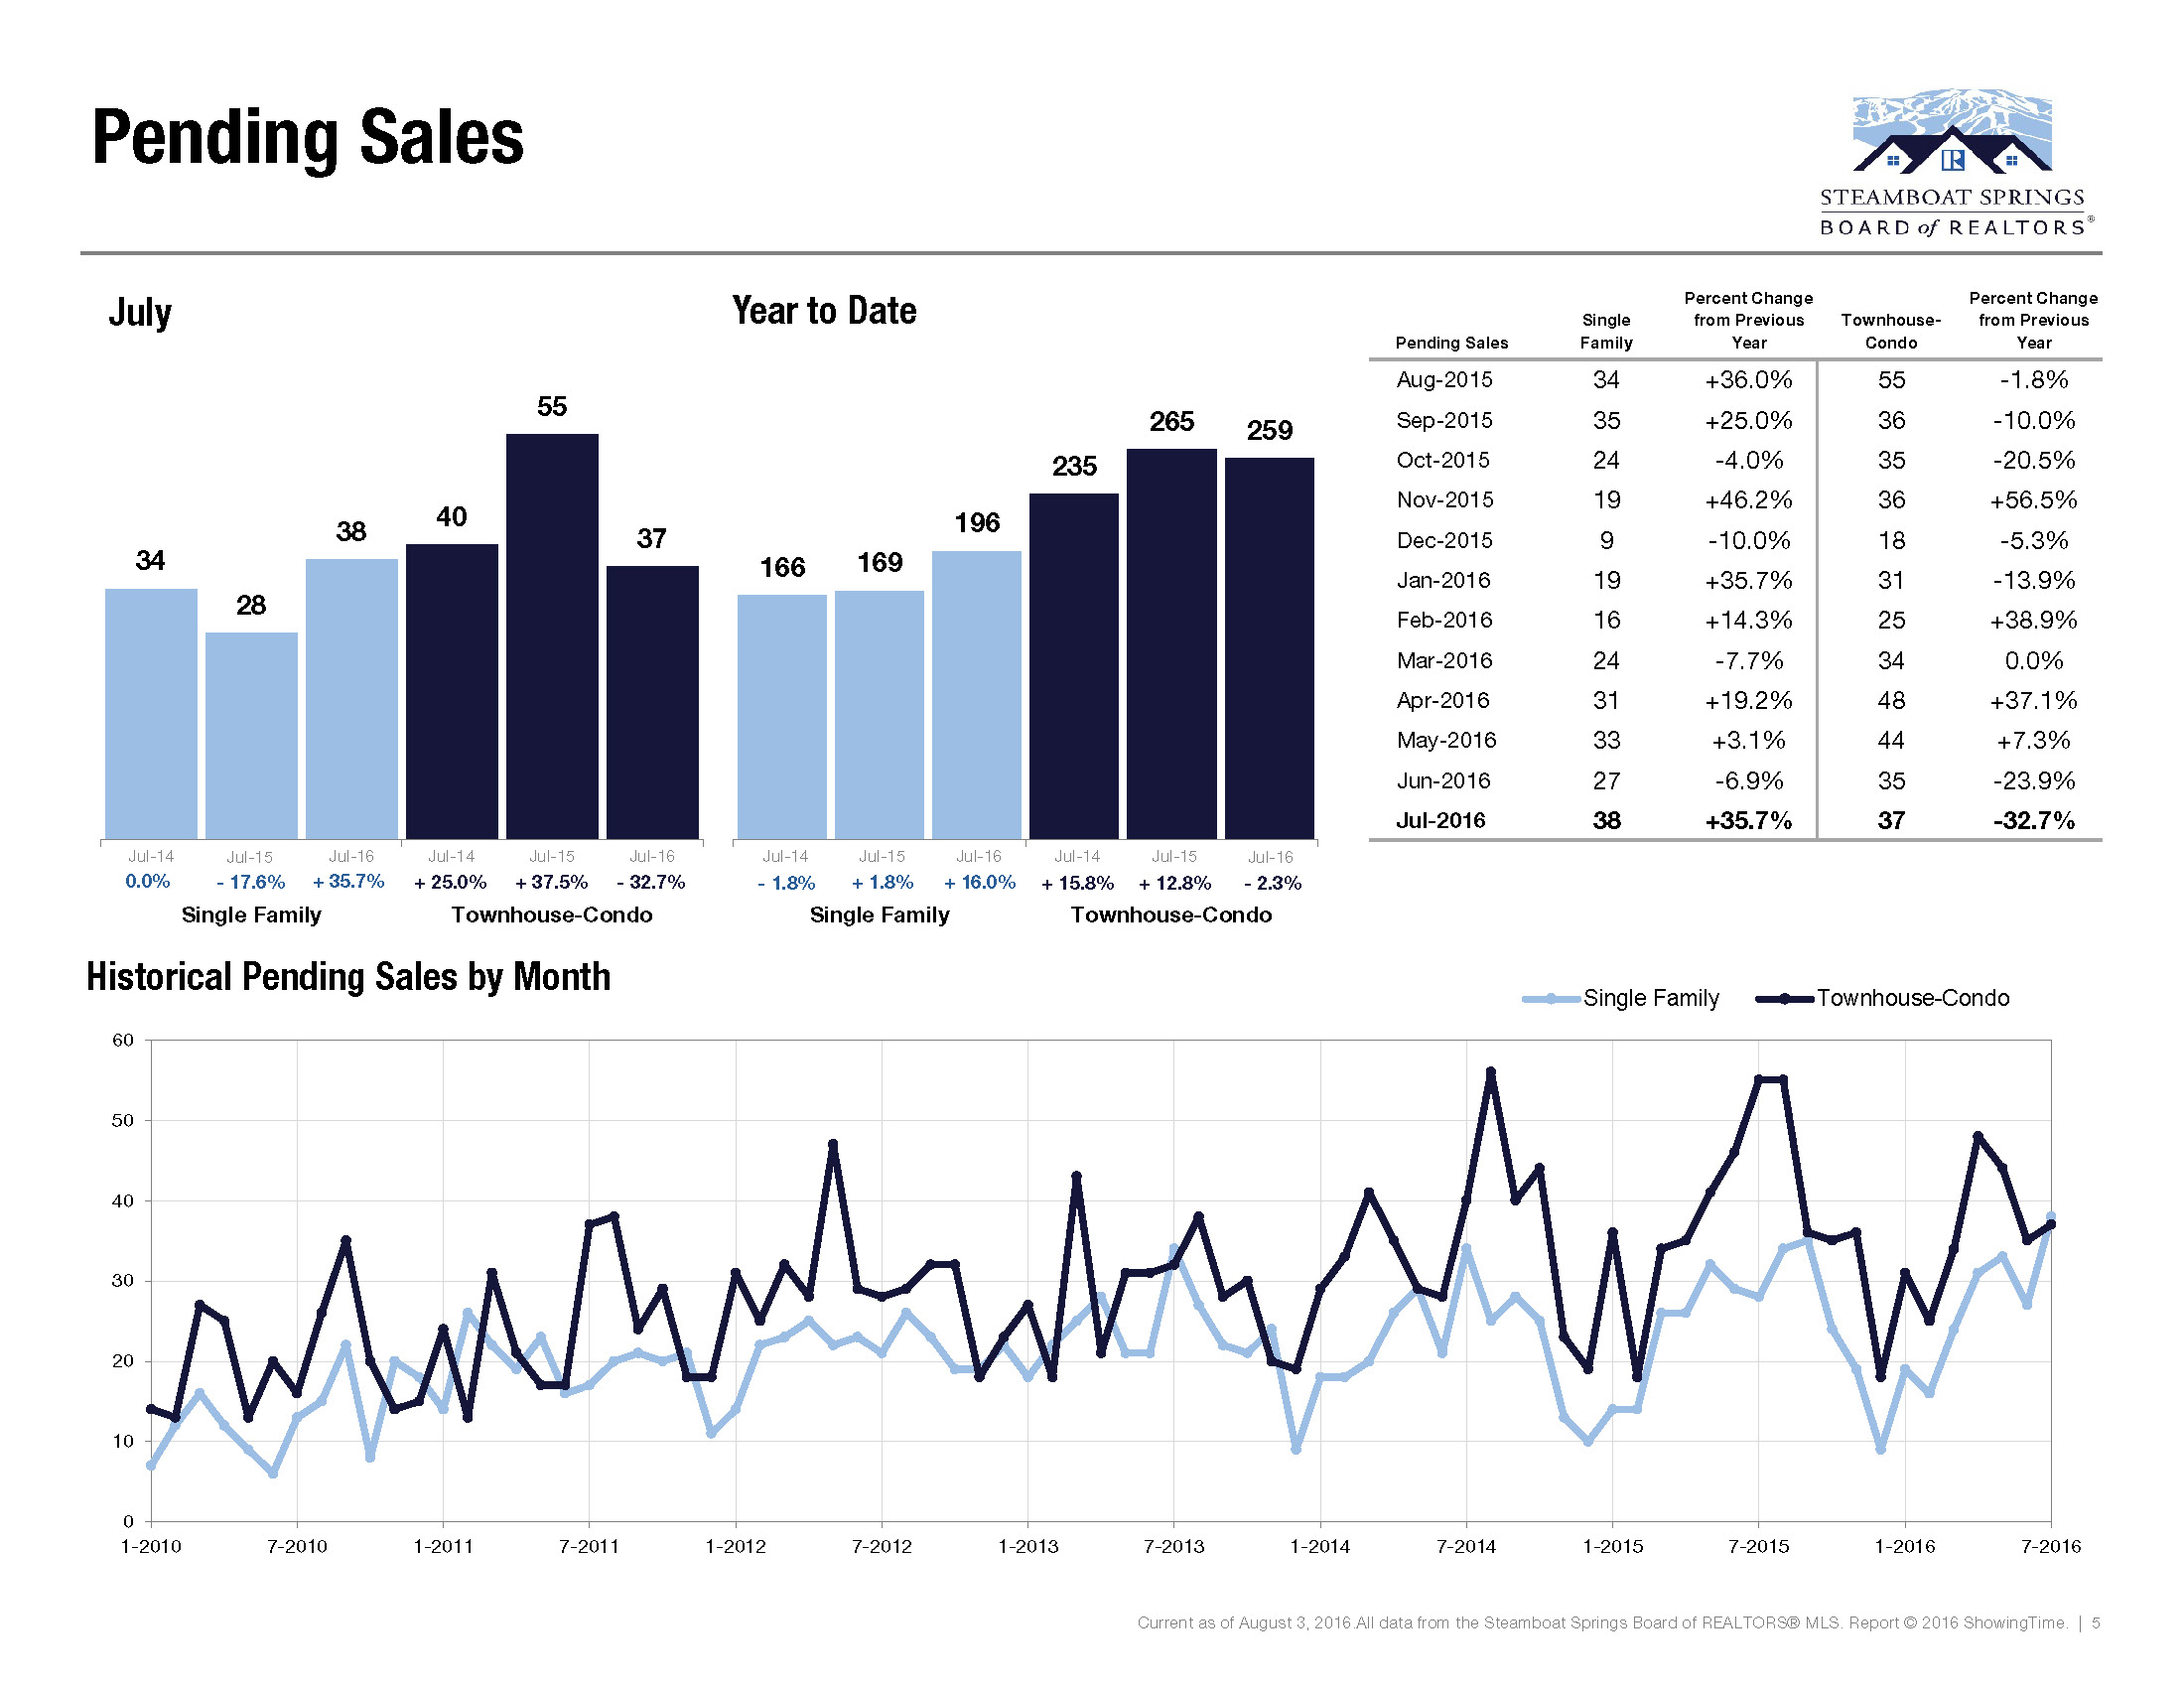
| Pending Sales Aug-2015 |
Single Family 34 |
Percent Change +36.0% |
Townhouse- Condo 55 |
Percent Change -1.8% |
| Sep-2015 | 35 | +25.0% | 36 | -10.0% |
| Oct-2015 | 24 | -4.0% | 35 | -20.5% |
| Nov-2015 | 19 | +46.2% | 36 | +56.5% |
| Dec-2015 | 9 | -10.0% | 18 | -5.3% |
| Jan-2016 | 19 | +35.7% | 31 | -13.9% |
| Feb-2016 | 16 | +14.3% | 25 | +38.9% |
| Mar-2016 | 24 | -7.7% | 34 | 0.0% |
| Apr-2016 | 31 | +19.2% | 48 | +37.1% |
| May-2016 | 33 | +3.1% | 44 | +7.3% |
| Jun-2016 | 27 | -6.9% | 35 | -23.9% |
| Jul-2016 | 38 | +35.7% | 37 | -32.7% |
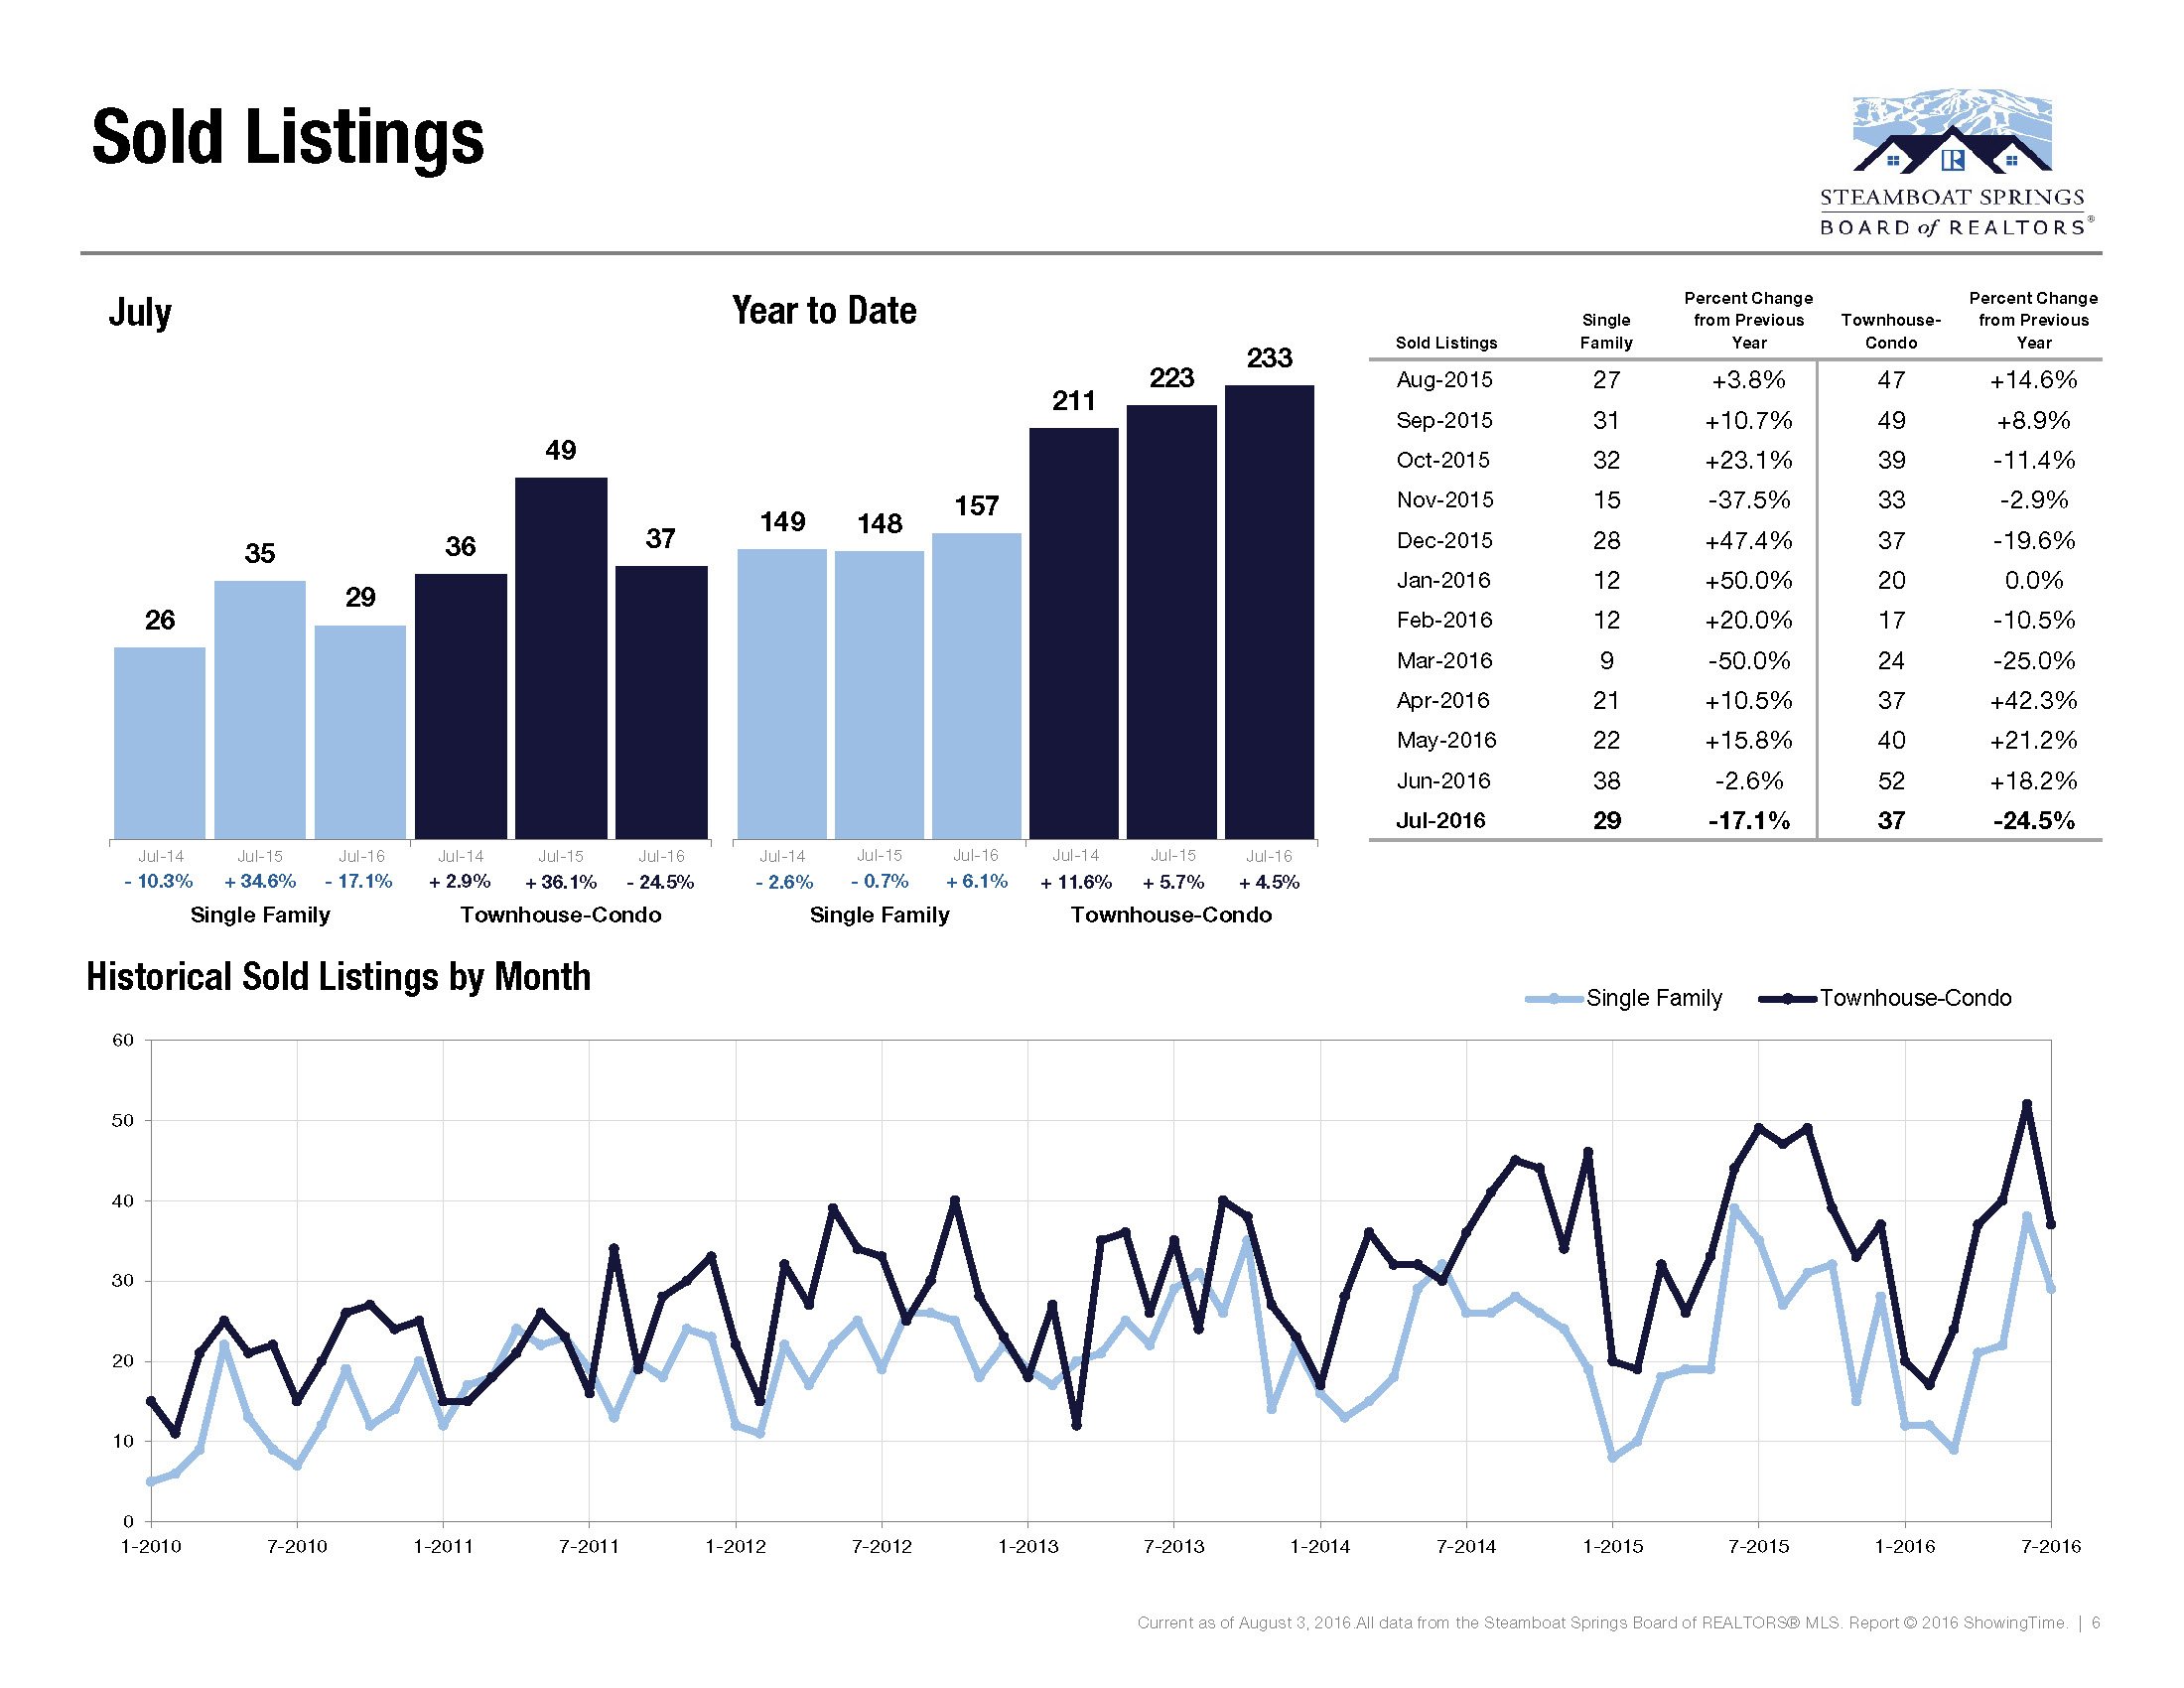
| Pending Sales Aug-2015 |
Single Family 27 |
Percent Change +3.8% |
Townhouse- Condo 47 |
Percent Change +14.6% |
| Sep-2015 | 31 | +10.7% | 49 | +8.9% |
| Oct-2015 | 32 | +23.1% | 39 | -11.4% |
| Nov-2015 | 15 | -37.5% | 33 | -2.9% |
| Dec-2015 | 28 | +47.4% | 37 | -19.6% |
| Jan-2016 | 12 | +50.0% | 20 | 0.0% |
| Feb-2016 | 12 | +20.0% | 17 | -10.5% |
| Mar-2016 | 9 | -50.0% | 24 | -25.0% |
| Apr-2016 | 21 | +10.5% | 37 | +42.3% |
| May-2016 | 22 | +15.8% | 40 | +21.2% |
| Jun-2016 | 38 | -2.6% | 52 | +18.2% |
| Jul-2016 | 29 | -17.1% | 37 | -24.5% |
Read the entire report here
[gview file=”https://assets.thesparksite.com/uploads/sites/1542/2016/08/Steamboat-Market-Profile-2016-July-1.pdf”]